Real estate siteEstatelyhas released a new report that uses an MBTA map to show how much homebuyers could expect to pay to live near different T stops. The site analyzed the last six months of data connected to home sales for houses, townhouses and condos within a half-mile of the stops along Boston’s transit lines. The report is arranged with the average prices accompanying each T stop on a map (alargeversionis available here). RELATED:This new residential building makes us want to move to the suburbs The Arlington stop on the Green Line had some of the area’s priciest real estate within a half-mile of a transit stop, with an average cost of $1,076 per square foot, according to Estately. At $193 per square foot, homes around the Beachmont stop on the Blue Line had the lowest cost on average. Homes near the Silver Line, which had an overall average of $754 per square foot, gave that train the highest average of all the lines, Estately reported. The Blue Line homes’ average price per square foot was the lowest at $479. RELATED:Why now is the time to sell in Greater Boston Of Estately’s top 10 priciest stops, four are along the Green Line in Back Bay: Hynes Convention Center, Prudential, Copley and Arlington.
New report shows how Boston home prices vary by T stop
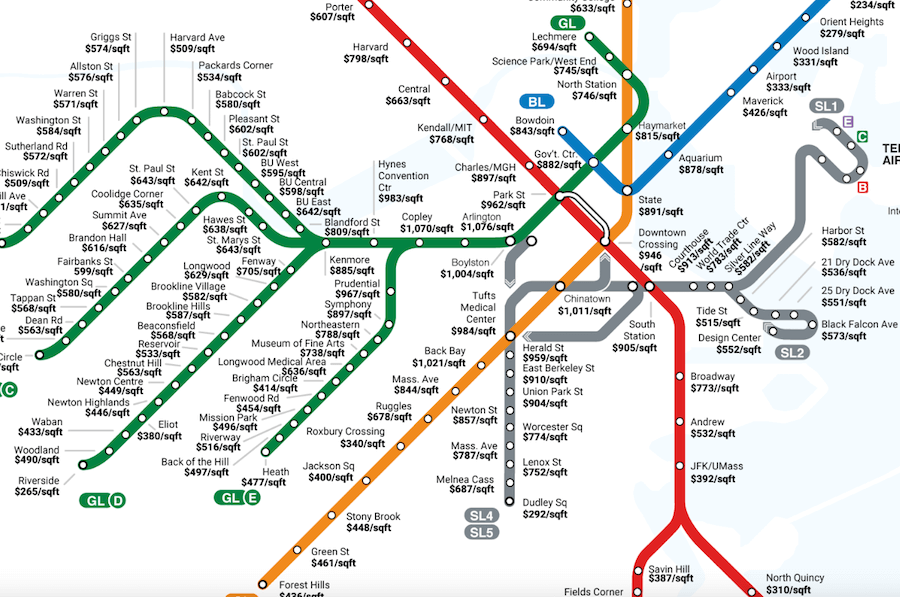
Estately