By Richard Leong, Dan Burns and Karen Brettell
The spread between yields on U.S. two-year and 10-year notes, a closely watched metric, is likely to invert for the first time since 2007. That would follow the inversion of another part of the yield curve earlier in the year. Here is what that means.
WHAT IS THE TREASURY YIELD CURVE?
The yield curve is a plot of the yields on all Treasury maturities – debt sold by the federal government – ranging from 1-month bills to 30-year bonds.
In normal circumstances, it has an arcing, upward slope because bond investors expect to be compensated more for taking on the added risk of owning bonds with longer maturities.
When yields further out on the curve are substantially higher than those near the front, the curve is referred to as steep. So a 30-year bond will deliver a much higher yield than a two-year note.
When the gap, or “spread”, is narrow, it is referred to as a flat curve. In that situation, a 10-year note, for instance, may offer only a modestly higher yield than a 3-year note.
WHAT IS A CURVE INVERSION?
On rare occasions, some or all of the yield curve ceases to be upward sloping. This occurs when shorter-dated yields are higher than longer-dated ones and is called an inversion.
While various economic or market commentators may focus on different parts of the yield curve, any inversion of the yield curve tells the same story: An expectation of weaker growth in the future.
In March, inversion of the yield curve hit 3-month T-bills for the first time in about 12 years when the yield on 10-year notes dropped below those for 3-month securities. That metric reverted back and then inverted again in May and is now trading at negative 36 basis points.
On Tuesday the curve between two-year and 10-year notes compressed to 1-1/2 basis points, the flattest since 2007.
The curve overall has been flattening for some time. The front-end to intermediate part of the curve inverted for the first time in a decade in December.
WHY DOES INVERSION MATTER?
Yield curve inversion is a classic signal of a looming recession.
For a graphic on bonds, click https://tmsnrt.rs/2YN5XYj
The U.S. curve has inverted before each recession in the past 50 years. It offered a false signal just once in that time.
When short-term yields climb above longer-dated ones, it signals short-term borrowing costs are more expensive than longer-term loan costs.
Under these circumstances, companies often find it more expensive to fund their operations, and executives tend to temper or shelve investments. Consumer borrowing costs also rise and consumer spending, which accounts for more than two-thirds of U.S. economic activity, slows.
The economy eventually contracts and unemployment rises.
WHY IS THE TWO-YEAR, 10-YEAR CURVE IMPORTANT?
The two-year Treasury, which is the shortest dated Treasury note, is highly sensitive to rate moves. The yield spread between this maturity and the benchmark 10-year note has traditionally been a popular focus for market participants, many of whom may not trade shorter-dated Treasury bills. It has been a solid indicator that a recession is likely one-to-two years later.
That said, the yield curve between three-month bills and 10-year notes has become an increasingly popular indicator of future weakness since the Federal Reserve identified it as a more accurate recession indicator than other parts of the curve.
An economic paper by the Federal Reserve Bank of San Francisco last year found that this part of the yield curve has better accuracy as a predictor of a recession 12 months into the future.
For a graphic on bonds, bills, click https://tmsnrt.rs/2MXddts
The curve’s inversion often ends before a recession begins.
A yield curve inversion does not predict the length nor severity of a downturn.
WHY DOES THE CURVE INVERT AT ALL?
Shorter-dated securities are highly sensitive to interest rate policy set by a central bank such as the U.S. Federal Reserve.
Longer-dated securities are more influenced by investors’ expectations for future inflation because inflation is anathema to bond holders.
So, when the Fed is raising rates, as it did for three years, that pushes up yields on shorter-dated bonds at the front of the curve. And when future inflation is seen as contained, as it is now because higher borrowing costs are expected to become a drag on the economy, investors are willing to accept relatively modest yields on long-dated bonds at the back end of the curve.
The two-year, 10-year yield curve initially steepened after the Fed in March stunned markets by abruptly abandoning its three-year drive to tighten monetary policy.
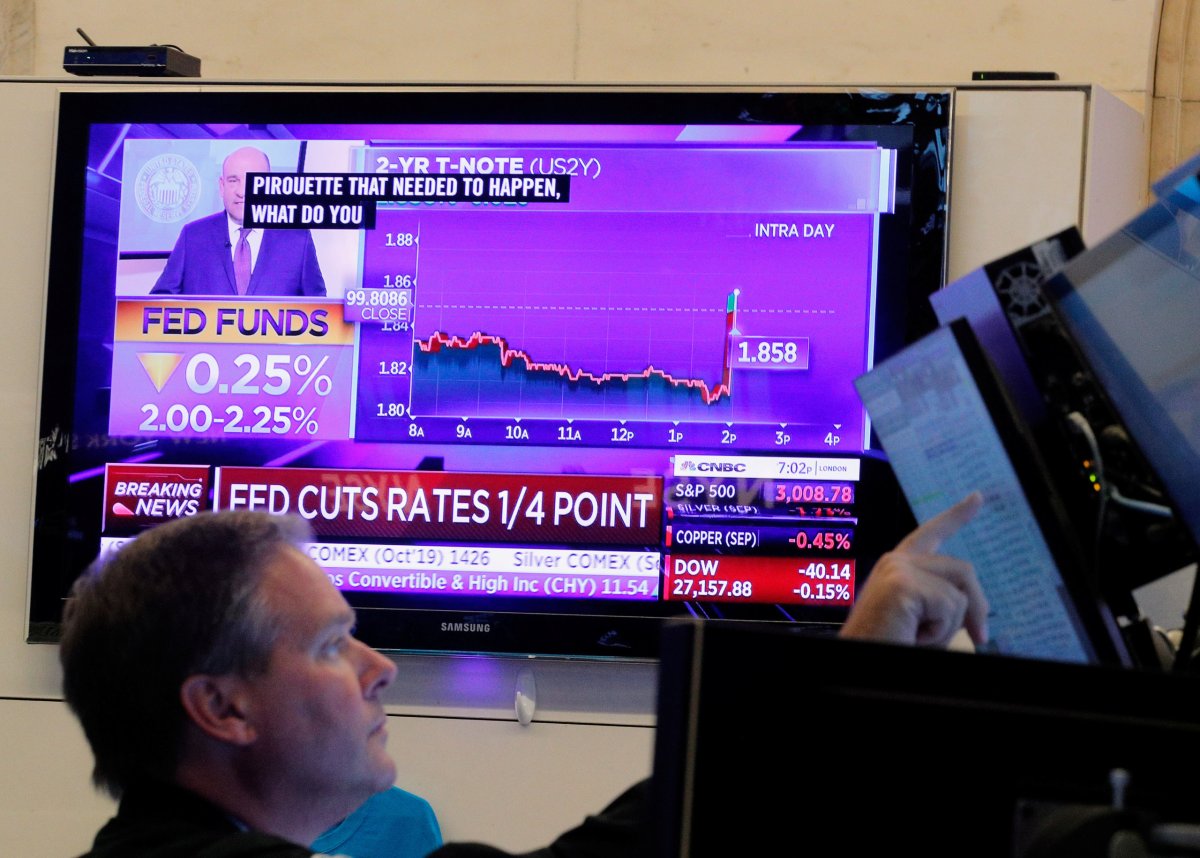
The U.S. central bank cut rates in July for the first time since 2008.
The curve resumed flattening in July, however, as concerns increased that weak international growth would spread to the U.S. economy and as the U.S.-China trade war weighed on business sentiment.
Increasingly, investors are concerned that more dovish central bank policies globally will not be enough to stimulate international growth.
(Reporting by Karen Brettell, Dan Burns and Richard Leong; editing by Megan Davies and Cynthia Osterman)