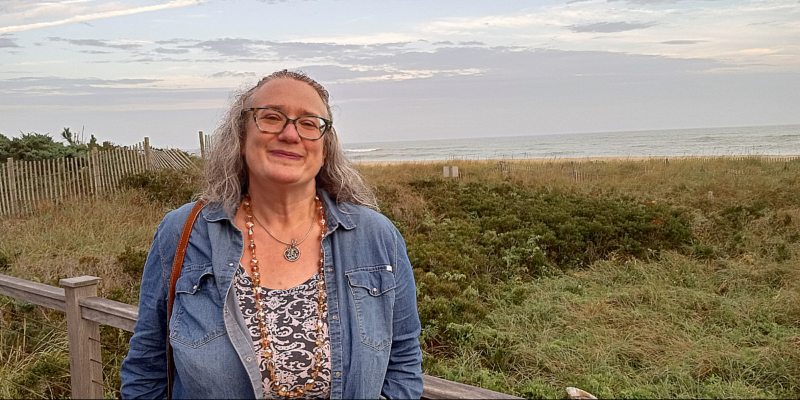
Michelle Johnson, a doctoral student at CUNY, created an infographic that tracks languages above the New York City subway system.
Credit: Courtesy Michelle Johnson, Languages Above the Subway
The subway system has some 5.5 million weekday riders speaking an eclectic blend of languages that mirror New York City’s own diversity.
Student and R train rider Michelle Johnson developed an infographic to track these languages for her capstone project in the Interactive Technology and Pedagogy Certificate Program at the CUNY Graduate Center.
Using data from the 2010 Census,‘Languages above the Subways’ shows what’s spoken in the neighborhoods over the train tunnels, from English and Spanish to Russian and Haitian Creole.
As a PhD candidate in linguistics, Johnson’s research focuses on how low-literacy bilingual adolescents in the city use digital devices to communicate. She studies Spanish students who live mostly on the A and 6 lines.
“The subway system defines an alternative geography for New York, and influences where people go as much as the physical geography,” Johnson said in an email.
The data can be viewed by each of the 21 subway lines or one of 13 languages. Users view the percentage of language speakers at each station along a certain line. For better comparisons, Johnson used larger languages, putting them on graphs if there were at least three stations with more than 5 percent speakers.
 An infographic shows the percentage of Russian speakers living in the zip codes above each B train station.
Credit: Courtesy Michelle Johnson, Languages above the Subways
Johnson admitted that the infographic might not provide a complete picture because using language data from the Census is tricky.
“If a person is undocumented, they may not be willing to answer the Census, and if they speak a language other than English at home, that information is never captured,” she said. The Census also doesn’t include fluency of languages at home.
After creating the infographic, Johnson said she was most intrigued by the results on her own train line.
 An infographic shows the percentage of Spanish speakers living in the zip codes above each R train station.
Credit: Courtesy Michelle Johnson, Languages above the Subways
“The R train goes through more language concentrations than any other train. In retrospect, this makes sense, since it goes through Forest Hills, Jackson Heights, Sunset Park and Bay Ridge, but I was still surprised,” she said.
Johnson said she thought the infographic would be interesting and useful to New Yorkers and subway riders.
“Many of us only get on or off the train at certain stops and have very little idea of what the neighborhood above is like,” she said. “This infographic helps illustrate that and since language and culture are deeply connected, it also shows where to experience certain cultures, practice certain languages, and eat certain foods.”
Follow Anna Sanders on Twitter @AnnaESanders