With less than a week to go before Election Day, Boston area residents might be wondering which candidate their neighbors support.
While there’s no way to tell who goes blue or who goes red come Nov. 8, Federal Election Commission data can tell you who has donated to Hillary Clinton, Donald Trump or any third-party candidate. In Suffolk County, 92 percent of donors went with Clinton. She has raised $3.7 million from 3,581 donors compared to Trump’s $127,586 from 274 donors, according to data from New York-based RentHop. Third party candidates Jill Stein and Gary Johnson have just 120 and 230 donors, respectively, throughout the entire state.
Clinton has steadily widened her lead in fundraising, nearly doubling her number of donors since July. Trump made only marginal gains.
Statewide, Clinton raised $18.3 million from Massachusetts donors compared to Trump’s $1.32 million.
The top six neighborhoods of Clinton donors were Harvard, Boston’s South End, Jamaica Plain, North Cambridge, Newtonville and Brookline.
Trump donors made up the majority in Dracut, Saugus, Hanson, North Weymouth, Pembroke and Tewksbury.
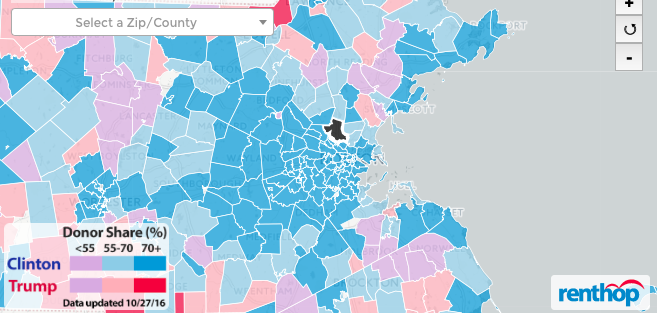
The map and graph belowshow the share ofunique donorseach candidate has in zip codes across the commonwealth. Candidates that have dropped out of the race are listed as “Past Dem” and “Past GOP”. The drop down list allows you to type in a zip code or county.You can also click a zip code on the map.Purple areasare where neither Clinton nor Trump has more than 55 percent of the donors.Light blue and light redrepresent areas where the candidate has 55 to 70 percent of the donors, anddark blue or red represents a 70 percent or higher majority.
Map shows which Boston-area neighborhoods donated to Trump, Clinton